Your agents can parse terabytes for cents, not millions.
A day from 64 GPUs is 3.3 million readings, about 20 million tokens. Hand that to an agent and it runs out of context, costs about $61 a question, and still misses the few minutes that matter.
 Backed by Y Combinator
20M
tokens of telemetry a day
$61
to read it once
6 min
of 24 h hold the cause
Reific finds the few minutes that matter.
It reads the whole fleet, keeps the windows and log lines that answer the question, and hands your agent about 1,000 tokens, with sources.
How Reific works
Why did p99 latency on the inference pool spike at 02:14?
3,317,760
readings · 41,208 log lines

96
readings · 2 log lines
Evidence packet
W1gpu-17 · GPU temptemp24 readings
71 → 89 °C
W2gpu-17 · SM clockclock18 readings
1,980 → 1,410 MHz
W3gpu-12, 31, 44 · queuequeue ×336 readings
rising on all 3
W4pool · p99 latencyp9918 readings
310 ms → 2.4 s
L102:11:52gpu-health.log #18442
gpu-17 clocks_event_reasons: HW_THERMAL_SLOWDOWN
L202:12:30scheduler.log #20917
scheduler: drained gpu-17, moved 18 replicas → gpu-12, gpu-31, gpu-44
limitations This data can’t show why gpu-17 overheated. Check facility sensors.
Agent answers
gpu-17 overheated and slowed down at 02:11. Its work moved to three other nodes. Their queues backed up, so p99 spiked at 02:14.
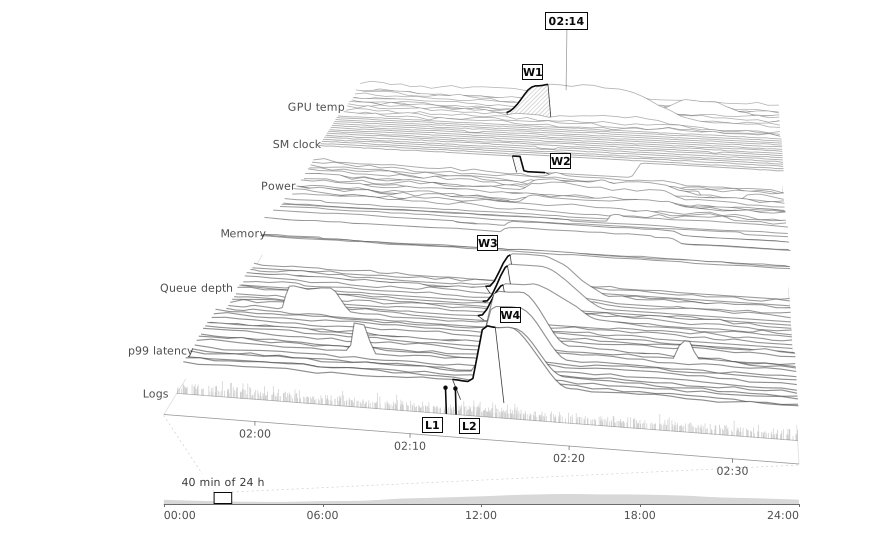
An agent asks why p99 latency on the inference pool spiked at 02:14. Reific searches 24 hours of telemetry from 64 GPU nodes, six signals each: 3,317,760 readings and 41,208 log lines. It returns 96 readings in four windows, plus two log lines.
- W1: gpu-17 temperature rises from 71 to 89 °C. 24 readings.
- L1: at 02:11:52, the GPU health log reports a thermal slowdown on gpu-17.
- W2: gpu-17 SM clock drops from 1,980 to 1,410 MHz. 18 readings.
- L2: at 02:12:30, the scheduler moves 18 replicas from gpu-17 to gpu-12, gpu-31 and gpu-44.
- W3: queue depth rises on those three nodes. 36 readings.
- W4: pool p99 latency rises from 310 ms to 2.4 s. 18 readings.
Each item links to its source. Limitation: this data can’t show why gpu-17 overheated; check facility sensors. The agent answers from the packet and cites every source.
Your agent gets three lines, not a data dump.
Without Reific
about 20 million tokenstime,node,gpu_temp_c,sm_clock_mhz,power_w,mem_gb,queue_depth,p99_ms 2026-09-29 02:11:40,gpu-03,55.6,1980,216,36.1,4,260 2026-09-29 02:11:40,gpu-12,61.2,1965,227,50.8,7,282 2026-09-29 02:11:40,gpu-17,88.5,1980,176,33.8,7,256 2026-09-29 02:11:40,gpu-26,56.6,2010,209,28.8,7,311 2026-09-29 02:11:40,gpu-31,60.2,1980,236,40.6,4,274 2026-09-29 02:11:40,gpu-40,58.1,1980,196,29.9,8,289 2026-09-29 02:11:40,gpu-44,59.5,2010,213,27.1,12,301 2026-09-29 02:11:40,gpu-58,56.2,1980,220,31.3,8,300 2026-09-29 02:11:50,gpu-03,55.6,1980,220,36.2,4,258 2026-09-29 02:11:50,gpu-12,61.2,1950,223,50.7,6,282 2026-09-29 02:11:50,gpu-17,88.8,1695,167,33.9,7,255 2026-09-29 02:11:50,gpu-26,56.5,1995,209,28.7,7,315 2026-09-29 02:11:50,gpu-31,60.2,1980,234,40.6,4,274 2026-09-29 02:11:50,gpu-40,58.0,1965,202,29.7,7,290 2026-09-29 02:11:50,gpu-44,59.4,2010,216,27.0,13,307 2026-09-29 02:11:50,gpu-58,56.0,1965,221,31.3,8,301
… 552,944 more rows and 41,208 log lines
With Reific
about 1,000 tokens- 02:11
gpu-17 overheats (71 → 89 °C) and cuts its clock speed by 29%.W1W2L1
- 02:12
The scheduler moves its work to gpu-12, gpu-31 and gpu-44. Their queues back up.L2W3
- 02:14
Pool p99 latency jumps from 310 ms to 2.4 s.W4
Each line links back to the readings and log lines behind it.
See the full evidence packet (JSON)
{ "question": "Why did p99 latency on the inference pool spike at 02:14?", "summary": "gpu-17 overheated and slowed down at 02:11. Its work moved to three other GPUs, their queues backed up, and pool p99 spiked at 02:14.", "time_window": { "from": "02:09:00", "to": "02:14:50", "searched": "24 h · 64 GPU nodes × 6 signals · 41,208 log lines" }, "selected_signals": [ { "ref": "W1", "signal": "gpu_temp", "node": "gpu-17", "period": "02:09:00–02:12:50", "what_happens": "gpu-17 heats up until it reaches its thermal limit.", "data_shape": "Climbs steadily, about 7 °C a minute, from 02:09 to 02:11:20, then levels off at 89–90 °C.", "change": "71 → 89 °C", "readings": 24 }, { "ref": "W2", "signal": "sm_clock", "node": "gpu-17", "period": "02:11:00–02:13:50", "what_happens": "gpu-17 slows itself down to stop overheating, losing 29% of its speed.", "data_shape": "Flat at 1,980 MHz, then drops to 1,410 MHz within 20 s, right after the thermal warning (L1), and stays there.", "change": "1,980 → 1,410 MHz", "readings": 18 }, { "ref": "W3", "signal": "queue_depth", "nodes": ["gpu-12", "gpu-31", "gpu-44"], "period": "02:12:00–02:13:50", "what_happens": "Requests pile up on the three GPUs that took over gpu-17’s work.", "data_shape": "Flat until 02:12:30, when the work moves (L2), then rises steadily on all three together, from under 15 to 53–61 waiting requests, still climbing at 02:13:50.", "change": "rising on all 3", "readings": 36 }, { "ref": "W4", "signal": "p99_latency", "node": "pool", "period": "02:12:00–02:14:50", "what_happens": "Response times for the whole pool jump about 8×.", "data_shape": "Flat around 305 ms until 02:13:20, then a sharp rise to 2.4 s by 02:14:10, easing only slightly after.", "change": "310 ms → 2.4 s", "readings": 18 } ], "source_references": [ { "ref": "W1", "source": "gpu-17 · gpu_temp · 02:09:00–02:12:50 · 10 s" }, { "ref": "W2", "source": "gpu-17 · sm_clock · 02:11:00–02:13:50 · 10 s" }, { "ref": "W3", "source": "gpu-12, gpu-31, gpu-44 · queue_depth · 02:12:00–02:13:50 · 10 s" }, { "ref": "W4", "source": "pool · p99_latency · 02:12:00–02:14:50 · 10 s" }, { "ref": "L1", "at": "02:11:52", "source": "gpu-health.log #18442", "line": "gpu-17 clocks_event_reasons: HW_THERMAL_SLOWDOWN", "meaning": "gpu-17 reports that it is slowing down because it is too hot." }, { "ref": "L2", "at": "02:12:30", "source": "scheduler.log #20917", "line": "scheduler: drained gpu-17, moved 18 replicas → gpu-12, gpu-31, gpu-44", "meaning": "The scheduler takes gpu-17 out of service and moves its work to three other GPUs." } ], "limitations": [ "This data can’t show why gpu-17 overheated. Check facility sensors." ]}Better answers. Fewer tokens.
50%
better at answering correctly
40%
fewer tokens
Research
Free: a time-series skill for Claude.
One skill file that teaches Claude to compute over time series instead of reading raw rows, more accurately and for less.
+8%
more questions answered correctly by Claude Haiku 4.5
14%
lower cost per question with Claude Opus 5.5
- Profile firstCadence, gaps, empty values, zeros and stuck sensors, before any calculation
- Missing is not zeroA gap is no reading, never a drop
- LimitsHow long a signal stayed past a limit, with gaps ending the run
- Level shiftsMedians before and after, not the biggest single jump
- Time of dayEach value against the same hour on other days
- Three stepsOne look at the data, one script, one check, then the answer
Per-model stats
| Model | Without | With the skill | Cost |
|---|---|---|---|
| Claude Haiku 4.5 | 86% | 93% | −8% |
| Claude Sonnet 5.5 | 87% | 91% | −3% |
| Claude Opus 5.5 | 96% | 99% | −14% |
Bring one incident from your fleet.
We’ll show you what your agent would have found, and the evidence behind it. If we can’t find the cause in your data, you’ve lost nothing but 30 minutes.
Book a 30-minute session