 Backed by Y Combinator
Missing sensor data or a real drop?
Missing readings and zero-valued readings can produce the same sum. A controlled example using public energy data shows why coverage belongs in every time-series answer.
In this article
A smaller number can begin with a missing observation
An agent reviewing a changing data source needs to distinguish a change in the measured system from a change in what reached the dataset. A smaller energy sum could describe less energy use. It could also describe an incomplete record. The arithmetic can be correct while the sentence built around it answers a different question from the one the user asked.
This example makes that distinction inspectable. We take twelve consecutive appliance-energy readings from a public dataset, remove four values in one copy, and replace those same values with zero in another. These are deliberately constructed scenarios. The source readings have no gaps in this window, and we are not reporting a real communications failure, equipment shutdown, or customer outcome. The useful result is the difference between the claims each record can support. 12
One fixed window, three versions of the record
The source is the Appliances Energy Prediction dataset published by Luis Candanedo through UCI. We select the first two hours of its first complete day: timestamp labels from 12 January 2016, 00:00 through 01:50, at ten-minute intervals. The Appliances field is energy in Wh. Physical CSV lines 44–55, counting the header as line 1, contain the twelve selected readings. We preserve the source labels without assigning a timezone or an undocumented start-versus-end convention to each interval. 1
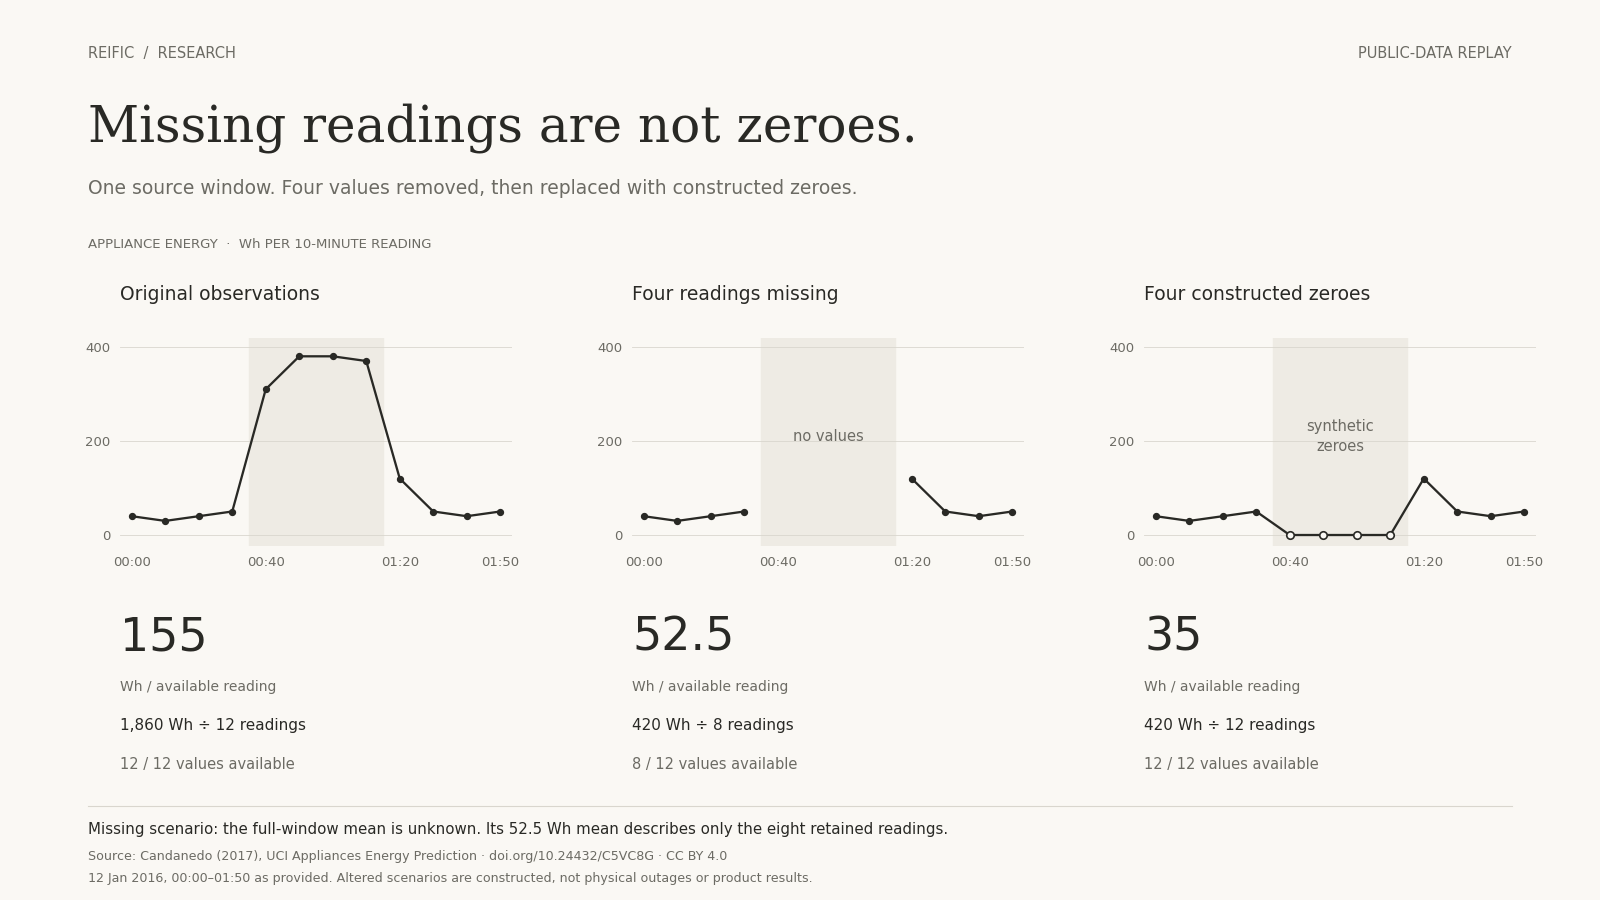
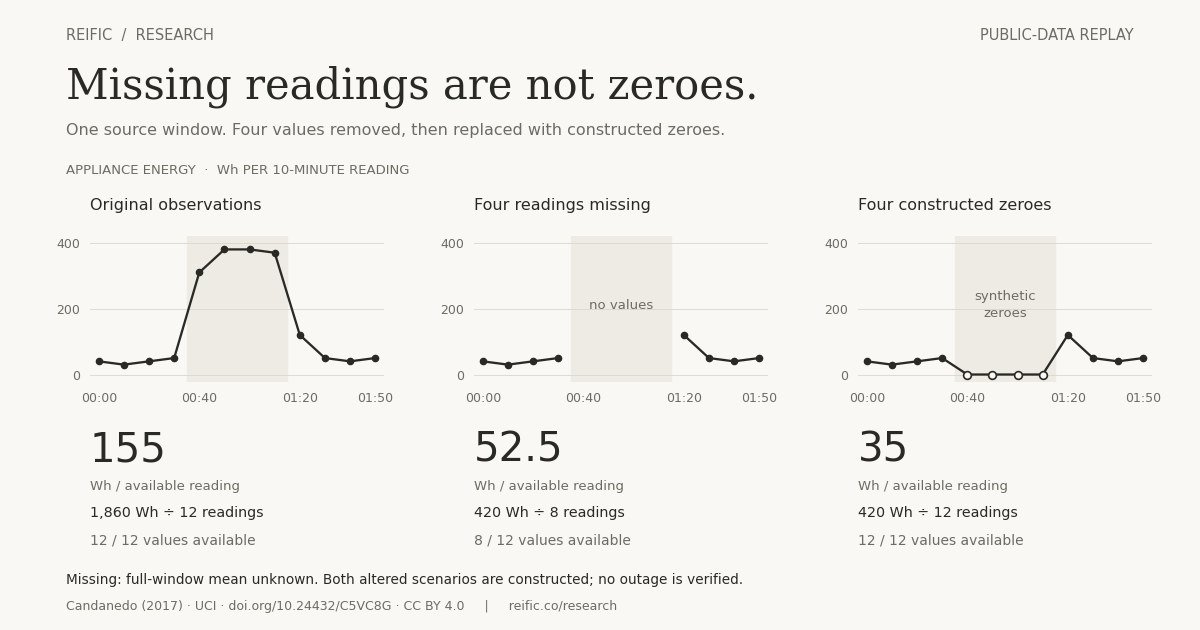
The original values are 40, 30, 40, 50, 310, 380, 380, 370, 120, 50, 40, and 50 Wh. Their sum is 1,860 Wh and their mean is 155 Wh per reading. Our construction changes the middle four values, at labels 00:40 through 01:10. The missing version retains those timestamp slots with unavailable values; the zero version contains four explicitly synthetic zeroes. Every other value remains unchanged. 2
Same twelve timestamp slots · energy per ten-minute reading
Original readings
Complete source window
12 / 12 readings available
1,860 Wh across all 12 readings
1860 ÷ 12 = 155 Wh
per available reading
Four readings missing
Constructed gaps
8 / 12 readings available
420 Wh observed; full total unknown
420 ÷ 8 = 52.5 Wh
per available reading
Four values set to zero
Constructed zeroes
12 / 12 readings available
420 Wh across all 12 constructed readings
420 ÷ 12 = 35 Wh
per available reading
In the incomplete record, the mean over all twelve intervals is unknown. Treating the gaps as zero would silently supply four values.
The same sum does not describe the same coverage
Both modified records have an available-value sum of 420 Wh. In the missing record, that sum covers only eight of twelve expected readings: 66.7% coverage. Its observed-only mean is 420 ÷ 8 = 52.5 Wh per available reading. The energy total and mean across all twelve intervals remain unknown from this incomplete record alone. A count of timestamp rows would miss the problem because the four empty slots are still present. Count usable values as well as expected intervals. 2
In the constructed zero record, all twelve values are present. Four of them are zero, so its mean is 420 ÷ 12 = 35 Wh per reading. Here 420 Wh is the total across the complete constructed window. That does not establish a physical explanation for a zero. A real monitoring workflow would still need to know whether zero is a valid measurement, an equipment state, a sensor default, or a sentinel that the source uses for missing data.
Zero-filling changes the question being answered
Replacing the four unavailable readings with zero makes the missing record numerically identical to the constructed zero record. The resulting mean of 35 is one-third below the observed-only mean of 52.5. That difference comes entirely from changing the denominator while keeping the available sum at 420. The transformation supplied four values that the incomplete record did not contain; it did not recover them from evidence. 2
Dropping missing values is not automatically a sound estimate of the full-window mean either. In this example the removed values are the high part of the series, so 52.5 is far below the known original mean of 155. We know that original mean because this is a controlled construction with the complete source retained for inspection. An agent given only the incomplete record would not have that knowledge. Its answer should distinguish an average of observed readings from an estimate for the whole period.
Return the evidence state with the number
A useful numerical tool response should make the requested period and denominator visible before the agent writes a conclusion. For the incomplete scenario, it can report the expected cadence, twelve expected observations, eight usable observations, four unavailable values, the observed sum, and the observed-only mean. It should mark full-period quantities as unavailable unless an explicitly chosen estimation method supports them. A null result and a numerical zero must survive serialization as different values.
The source contract matters as much as the aggregation. Some streams are event-driven, so an absence of events does not imply a missing scheduled sample. Some instruments accumulate a running counter rather than report energy per interval. A duplicate timestamp, a revised reading, or a change in sampling cadence can also change the denominator. Before comparing periods, establish what a row represents, which values are valid, and which records were available at the decision time. 4
- State the target, unit, selected period, expected cadence, and usable-value coverage.
- Keep unavailable values distinct from measured zeroes and explicitly constructed or imputed values.
- Label an available-value sum or observed-only mean with its actual denominator.
- Request corroborating source or equipment context before attributing a change to a physical cause.
Test missingness before trusting a monitoring conclusion
This gives a team a small, concrete check to run when evaluating an agent workflow. Start with a record whose contents are known, then supply a version with explicit gaps and a version with valid zeroes. Ask the same bounded question of each. Inspect whether the returned coverage changes, whether the calculation uses the intended denominator, and whether the explanation preserves the distinction. Include the complete record in the review materials without silently giving it to an agent that is meant to see only the incomplete version.
The check is about the evidence contract, not a universal coverage threshold. We have not measured an agent's accuracy, a detector's performance, or the frequency of these conditions in real operations. Twelve readings from one public window cannot establish those results. What this construction establishes is narrower and exact: identical available sums can belong to different observation states, and the three means answer different questions. A recurring review needs that distinction before it can use a lower number as evidence of a real change.
Reproduce every value
The downloads include the source window, both constructed records, machine-readable results, and a Python replay using only the standard library. The replay preserves source-row provenance, checks cadence and coverage, and verifies the calculations against explicit expected results. The instructions identify the pinned source file and its checksum, describe every modification, and explain how to run the example from the downloaded files. The figure shows the same twelve slots used in the calculation; there is no smoothing or downsampling. 23
The source data are credited to Luis Candanedo under CC BY 4.0. Reific selected the window, constructed the two modifications, and prepared the calculations and explanation. The downloadable zeroes and gaps must remain labeled as constructed if reused. This is a public methods example for evaluating how an agent handles numerical evidence; it is not a report of a deployed Reific customer investigation or a claim that Reific outperforms another tool.
Reproduce the example
- Reproduction instructions and source attribution
- Source window · 12 original readings (CSV)
- Constructed missing-readings scenario (CSV)
- Constructed zero-valued scenario (CSV)
- Exact calculations and provenance (JSON)
- Reproduction script · Python standard library
- Download the comparison figure (PNG)
- Download the share image (PNG)
Sources and attribution
Bring a recurring question, a sample of your time-series data, and an example of a gap or delayed reading. We can use a demo to scope the evidence your agent would need before reporting a change.